
Tweet-Style Posts: The Format You Can Always Fall Back On
Not every post needs a photo, a mockup, or a design concept. Some of the most effective organizing content is just words on a screen, formatted to look like the platform your audience already scrolls through every day. That's the whole idea behind this template.
Why this format works
Tweet-style graphics are about as close to evergreen as social content gets. There's no photo to source, no event date baked permanently into the design, no mockup to keep updated as trends shift. Swap the text, and the same template works for a data point this month and a completely different one next month. That makes it one of the easiest formats to keep in regular rotation, and it's also one of the better-performing ones, the format reads as commentary rather than an ad, which tends to earn more genuine engagement than a polished graphic does.
What's in the template
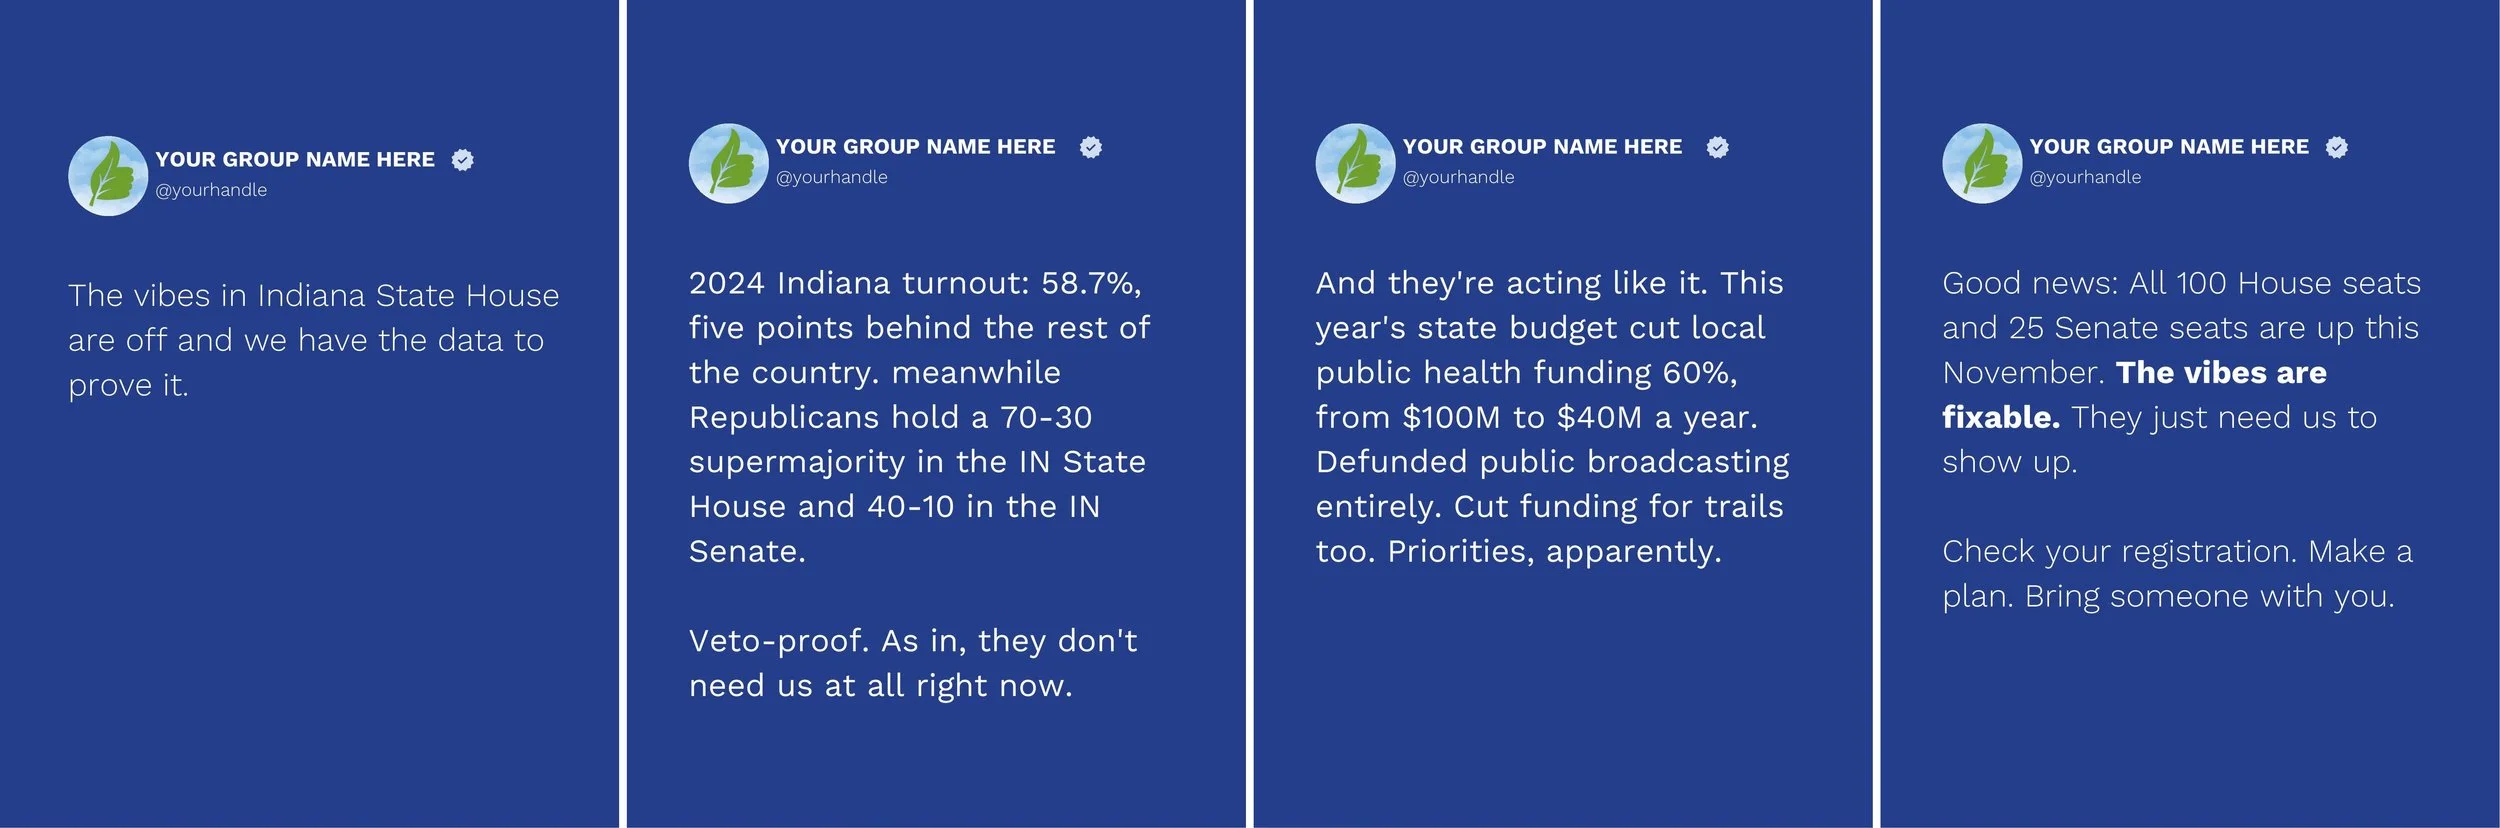
This one runs four slides, building a full argument in sequence:
Slide one is the hook: "the vibes in Indiana State House are off and we have the data to prove it." Casual, a little funny, and it promises the reader something concrete is coming.
Slide two delivers the data: turnout numbers next to the resulting supermajority, spelled out so the connection between the two is impossible to miss. Notice the bold text on "veto-proof", a small formatting choice that does a lot of work. Bolding your key phrase or number lets someone skimming stop exactly where you want them to, without needing to read every word.
Slide three makes the stakes real with specific consequences: budget cuts, in real dollar figures, to things people actually notice, public health funding, public broadcasting, trails. Abstract political power becomes a concrete list of what changed because of it.
Slide four turns to the fix: every seat is on the ballot, so the imbalance isn't fixed, it's fixable. The bolded line "The vibes are fixable" mirrors the hook from slide one, closing the loop, then ends with a clear, three-part call to action.
How to customize it for your group
Group name and handle, swapped into the header on all four slides.
Your state's turnout number and how it compares to the national average. This is what makes slide one land, a comparison, not just a raw percentage.
Your state's legislative composition, same as the Statehouse template, pull this from your state legislature's official site or Ballotpedia, and cite it.
Real, specific consequences, actual budget line items or policy decisions from your state's most recent legislative session, with dollar figures or percentages where you can find them. Specificity is what makes slide three hit, "priorities, apparently" only works because the cuts listed above it are real and checkable.
Bold key phrases as you go. Wherever there's a number, a stat, or the core point of a slide, bold it. That's what keeps a text-heavy format skimmable instead of feeling like a wall of text.
A note on sources
Every number in this template is only as convincing as where it came from, so it's worth citing yours. These numbers pull from:
Ballotpedia's voter turnout page for Indiana, for the 58.7% turnout figure and how it compares to the national average
Local news coverage from WANE 15 and WRTV of the 2025 state budget session, for the specific funding cut figures, public health, public broadcasting, and trails
When you adapt this for your own state, look for the same mix: a nonpartisan or state-level source for turnout and legislative composition (Ballotpedia and your own state legislature's official site both work well), and local news coverage for the concrete, dollar-figure consequences from your state's most recent budget. A bolded stat on a blue background reads as an opinion. The same stat with a source behind it reads as a fact, and facts matter.
Suggested caption
Not to be dramatic but the vibes in [your state] are, statistically, off.
We turned out at [X]% in [year], [X] points behind the national average, and it's a big part of how Republicans ended up with a veto-proof supermajority in our own statehouse.
And they're spending like they know it. This year's budget cut [specific funding], on top of [other cuts].
The fix isn't complicated though. [X] House seats and [X] Senate seats are on the ballot this [month/year]. That's a lot of chances to adjust the vibes.
Check your registration. Make a plan. Bring someone with you.
#BringYourPeopleToThePolls #[YourLocalGroup] #Vote[YourState] #ElectionDay2026
Sources: [your state's turnout data], [your state legislature's official site], [local reporting on your state budget]
How Goshen will use it
Not to be dramatic but the vibes in Indiana are, statistically, off.
We turned out at 58.7% in 2024, five points behind the national average, and it's a big part of how Republicans ended up with a veto-proof supermajority in our own statehouse.
And they're spending like they know it. This year's budget cut local public health funding 60%, from $100 million to $40 million a year, on top of defunding public broadcasting and Shanklin Pool’s 50+ year run. Goodbye summer swim days.
The fix isn't complicated though. All 100 House seats and 25 Senate seats are on the ballot this November. That's a lot of chances to adjust the vibes.
Check your registration. Make a plan. Bring someone with you.
#BringYourPeopleToThePolls #GoshenCityDemocraticParty #VoteIndiana #ElectionDay2026
